
Molinari Pools
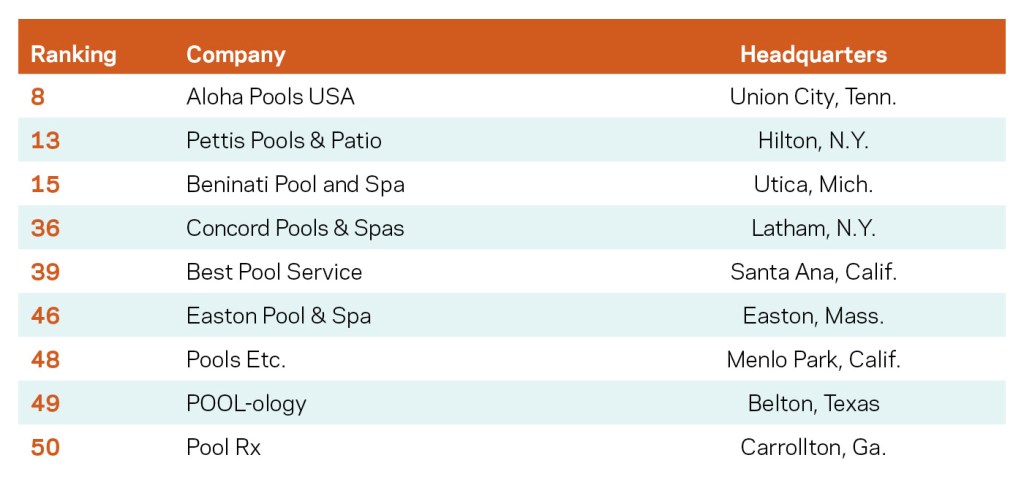
New to the List
This year we welcome nine service firms that have ranked on the Top 50 Service list for the first time.
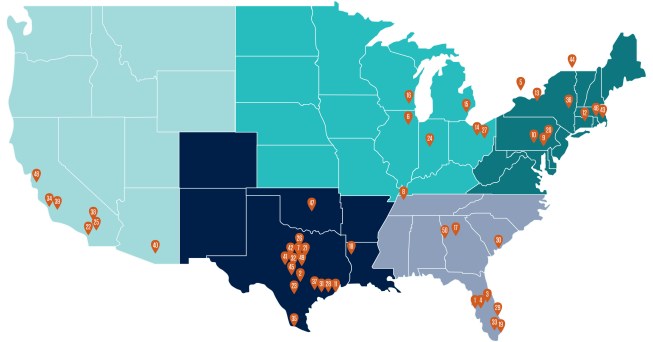
Top 50 Service by Region
The map below shows the regional distribution of this year’s Top 50 Service companies. Each tab represents one firm, showing its headquarter city. Numbers on the tabs indicate company ranking. Once again, Texas is well-represented, holding 15 of the slots, or 30%.
WEST
Total Service Companies: 7
Locations Providing Residential Pool Service: 9
Permanent Full-Time Service Technicians: 171
Average Tenure: 6 years
2023 Reported Total Service
Revenue: $25,630,464
• Residential Service Revenue: $20,953,798
• Commercial Service
Revenue: $3,008,142
Residential Accounts: 6,731
SOUTHWEST
Total Service Companies: 17
Locations Providing Residential Pool Service: 37
Permanent Full-Time Service Technicians: 1,088
Average Tenure: 5 years
2022 Reported Total Service
Revenue: $153,510,177
• Residential Service Revenue: $111,808,775
• Commercial Service
Revenue: $35,848,814
Residential Accounts: 56,031
Commercial Accounts: 6,987
MIDWEST
Total Service Companies: 6
Locations Providing Residential Pool Service: 7
Permanent Full-Time Service Technicians: 110
Average Tenure: 8.5 years
2022 Reported Total Service
Revenue: $27,502,809
• Residential Service Revenue: $17,723,259
• Commercial Service
Revenue: $3,912,540
Residential Accounts: 13,207
Commercial Accounts: 398
SOUTHEAST
Total Service Companies: 10
Locations Providing Residential Pool Service: 48
Permanent Full-Time Service Technicians: 1,045
Average Tenure: 4.5 years
2022 Reported Total Service
Revenue: $190,970,340
• Residential Service Revenue: $145,034,449
• Commercial Service
Revenue: $39,137,679
Residential Accounts: 51,900
Commercial Accounts: 4,271
NORTHEAST/MID-ATLANTIC
Total Service Companies: 10
Locations Providing Residential Pool Service: 17
Permanent Full-Time Service Technicians: 204
Average Tenure: 12.5 years
2022 Reported Total Service
Revenue: $41,693,135
• Residential Service Revenue: $34,438,002
• Commercial Service
Revenue: $746,015
Residential Accounts: 22,052
Commercial Accounts: 758
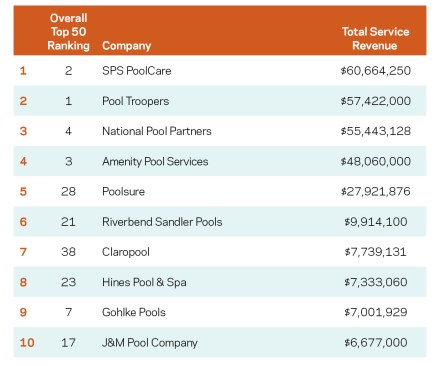
Top 10 Earners
Total service revenue makes up one of five scoring categories to determine the Top 50 Service firms. To get this number, we combine the reported residential service revenue with commercial service revenue.
Top 10 Websites
Websites were judged as part of the scoring process. This time around, we had a web expert examine these companies’ sites. Below are those that received the highest scores, along with our judge’s observations.